What Is a Good Open Rate for Email Marketing in 2026?
What a realistic email open rate looks like in 2026, how it's calculated, why benchmark sources disagree, and which metrics matter more than opens.

On this page
Open rate is usually the first metric marketers check after sending a campaign, but a single benchmark rarely tells the full story: industry reports alone place the average anywhere between 21.5% and 35.63%.
This article covers what a realistic range looks like, how the metric is calculated, why sources disagree so widely, and which other email marketing metrics should be read alongside it before judging campaign performance.
Key takeaways
- A good email open rate typically falls between 17% and 35%, depending on industry, list type, and how opens are measured.
- Below 15% usually signals a list-quality or deliverability problem, while 35%+ points to a highly engaged list or a more generous tracking method.
- Apple Mail Privacy Protection and spam filters can inflate opens, so treat open rate as one directional signal, not proof of success.
- Read open rate alongside CTR, CTOR, conversion, and unsubscribe rate, and benchmark against your own history, not just industry averages.
What is a good open rate for email marketing?
A good email open rate typically falls between 17% and 35%, depending on industry, list type, and how the metric is measured.
Landing in the low twenties puts a campaign in line with the broader market average. Crossing 30% indicates strong performance. Rates above 35-40% are generally seen in highly engaged or niche audiences.
There is no single benchmark that applies equally to every business. Open rate depends on several factors: industry, whether the list is opted-in or cold, where subscribers sit in the funnel, sending frequency, and, perhaps most importantly, how clean and engaged the list actually is.
Instead of chasing one universal number, it is more useful to understand the realistic range, know why it varies so much between sources, and set expectations based on your own context.
What range should I use as a realistic benchmark?
The two most commonly cited industry reports on average email open rate differ noticeably. Campaign Monitor places the healthy range at 17-28%, with an all-industry average of about 21.5%, based on data from 2021.
Mailchimp reports a more recent all-user average closer to 35.63%, based on data last updated in December 2023, with some sectors, such as nonprofits, exceeding 40%.
This is a significant gap between two well-regarded sources, and it does not mean one of them is incorrect. The difference comes down to methodology: different customer bases, different definitions of “opened” email, different reporting periods, and different mixes of transactional versus promotional sends. This is explained in more detail further below.
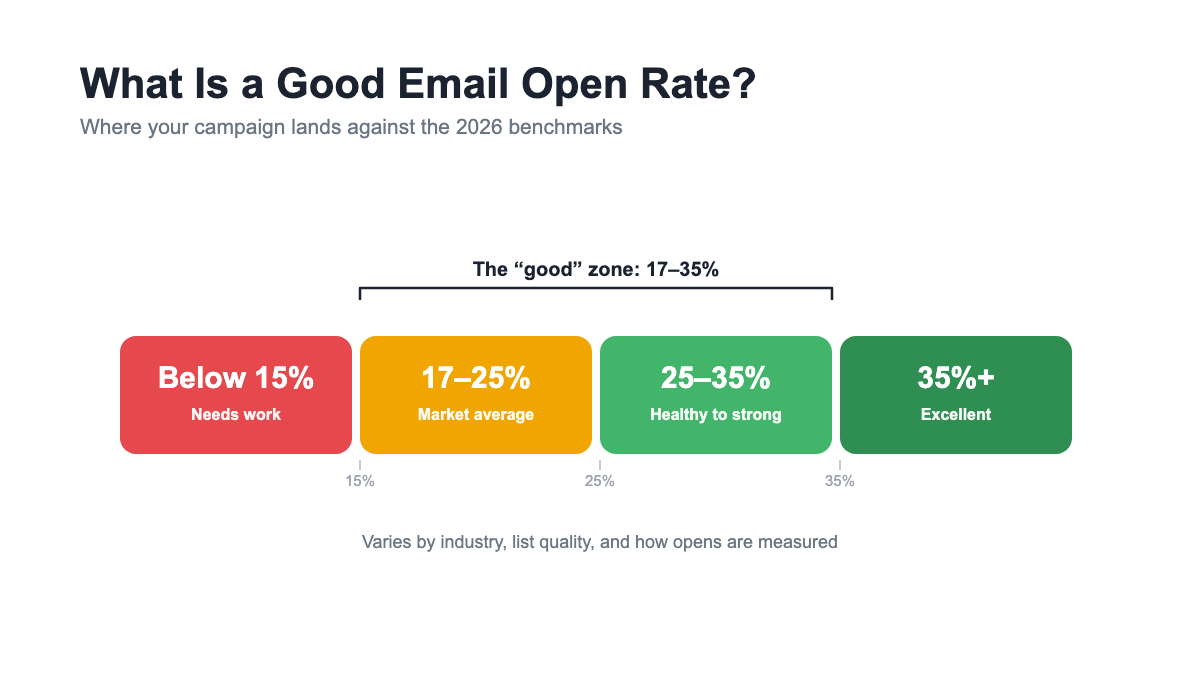
As a general reference point:
- Below 15%: usually indicates an issue with list quality, deliverability, or relevance
- 17-25%: consistent with the broader market average
- 25-35%: healthy to strong, typical of a well-segmented list
- 35%+: excellent, generally associated with highly engaged or niche audiences, or a more generous open-tracking methodology
Why open rate alone can be misleading?
Open rate is a less precise metric than it used to be, and relying on it as the sole measure of success can be misleading.
Apple’s Mail Privacy Protection pre-loads images for a large share of iPhone and Mac users, which means an email can register as “opened” even if the recipient never actually viewed it.
Corporate spam filters and security scanners can trigger the same tracking pixel before a human ever reaches the inbox.
In addition, “open rate” carries a different meaning for a permission-based newsletter than for a cold outreach campaign, which makes direct comparisons between the two unreliable.
None of this makes open rate irrelevant. It should be treated as one directional signal among several, not as a definitive measure of campaign success.
What is email open rate and how is it calculated?
Open rate is the percentage of delivered emails that are opened by a recipient. The word “delivered” is important here: open rate should be calculated based on emails that actually reached an inbox, not the total number sent.
Some emails bounce before delivery, and including those in the denominator will understate the real result.
Open rate formula with a simple example
The open rate formula is straightforward:
Open rate = (Number of opens / Number of emails delivered) x 100
For example: a campaign is sent to 2,000 people. 100 of those emails bounce, leaving 1,900 delivered. Of those, 500 are opened. The rate would be:
500 / 1,900 x 100 = 26.3%
Note that the calculation uses delivered emails (1,900), not total sent (2,000). Using the wrong denominator will skew every benchmark comparison made afterward.
Unique opens vs total opens
Platforms typically track two different figures: unique opens (the number of individual recipients who opened the email, counted once each) and total opens (every instance the email was opened, including repeat opens by the same person).
For benchmarking purposes, unique opens should always be used. If one recipient opens an email three times, that should count as a single open for benchmarking purposes, not three.
Confusing unique and total opens is one of the most common reasons two reports on the same campaign can show very different numbers.
What is a good average open rate by industry?
An all-industry average has limited practical value. Industry-specific email marketing statistics are a more useful comparison than a single blended number, since sending profiles vary widely between sectors; comparing an ecommerce promotional list to a nonprofit newsletter, for example, would not produce a meaningful conclusion.
The ranges below combine Campaign Monitor’s 2021 data with Mailchimp’s data through December 2023, which is why some industries show a wide spread.
| Industry | Typical Open Rate Range |
|---|---|
| Education | 28–36% |
| Financial Services / Business & Finance | 27–31% |
| Nonprofits | 26–40% |
| Government & Politics | 19–41% |
| Healthcare | 23–24% |
| IT / Tech / Software | 22–23% |
| Media, Entertainment, Publishing | 23–24% |
| Advertising & Marketing | 20–21% |
| Travel, Hospitality, Leisure | 20% |
| Retail / Ecommerce | 17–30% |
| Restaurant, Food & Beverage | 18–19% |
Industries with higher open rates
Education, financial services, and nonprofits tend to report the highest open rates. These sectors typically send fewer, more relevant emails (tuition deadlines, account alerts, donation impact updates) that read as necessary information rather than promotional content.
There is also a trust factor: recipients are more inclined to open an email from an institution they already have an established relationship with, independent of the subject line.
Industries with lower open rates
Retail, ecommerce, and food & beverage typically report lower open rates, largely due to sending volume. These industries tend to send frequent promotional emails, and subscribers become accustomed to that pattern, which naturally lowers engagement per send.
This is not necessarily a sign of a problem; it is often simply the nature of high-frequency promotional sending. The more useful exercise is comparing results against similar high-frequency senders, not against a monthly B2B newsletter with a different cadence.
Which email metrics matter besides open rate?
A “good” open rate that does not translate into clicks, conversions, or revenue provides limited value on its own. Open rate should be read alongside a set of complementary metrics: click-through rate (CTR), click-to-open rate (CTOR), conversion rate, and unsubscribe rate.
What is CTR in marketing?
Click-through rate (CTR) measures the percentage of delivered emails that generated at least one click. The formula is:
CTR = (Total Clicks / Emails Delivered) x 100
A healthy CTR typically falls between 2–5%, with an all-industry average around 2.3% per Campaign Monitor’s 2021 data and 2.6% per Mailchimp’s more recent figures.
The average CTR for cold lists tends to sit well below that range, often closer to 0.5–1%, since recipients have no prior relationship with the sender and no expectation of receiving the email.
CTR is often a stronger indicator of genuine interest than open rate, since clicking requires deliberate action, while an open rate can be triggered automatically by image pre-loading.
What are CTOR and click per rate?
Click-to-open rate (CTOR) measures how well the content performed after the email was opened. The formula is:
CTOR = (Unique Clicks / Unique Opens) x 100
If open rate indicates whether the subject line was effective, CTOR indicates whether the content itself delivered on that promise.
A high open rate combined with a low CTOR usually points to a mismatch between what the subject line implied and what the email actually contained.
The term “click per rate” also appears occasionally, though it is used inconsistently across the industry, sometimes referring to CTR, sometimes to CTOR, and sometimes to conversion rate.
When encountering this term, it is worth confirming exactly what is being measured before drawing conclusions.
How should I interpret conflicting benchmark reports?
This is one of the more practical questions to address when comparing email marketing benchmarks across sources.
Campaign Monitor and Mailchimp, two of the most frequently cited sources in the industry, report noticeably different averages.
This discrepancy is not a flaw in either report; it is a reminder that benchmarks should be read critically rather than taken at face value.
Why do platforms report different average open rates?
Several factors explain the gap. First, sample composition: different platforms serve different customer bases, ranging from small opt-in newsletters to enterprise transactional senders.
Second, reporting period: Campaign Monitor’s figures reflect 2021 data, while Mailchimp’s reflect data through December 2023, and open rates have shifted noticeably in between as Apple’s privacy changes began affecting tracking accuracy.
Third, definitions: not every platform calculates “delivered” the same way, and some reports exclude low-volume senders or specific campaign types before publishing averages.
This does not mean benchmarks should be disregarded. It means any single figure should be treated as a directional reference rather than an absolute standard, with more recent reports weighted more heavily given the impact of privacy changes on tracking.
What factors increase or decrease email open rates?
A number of factors influence open rate, some more obvious than others: deliverability, segmentation, sender recognition, timing, frequency, subject line, preheader, list hygiene, and subscriber intent.
Some of these levers can also be used to inflate open rate artificially, which typically comes at the cost of trust, CTOR, and long-term list health, as covered below.
Subject lines, sender name, and preheader
These three elements have the greatest direct influence on the decision to open an email. A recognizable sender name builds immediate trust: a named sender outperforms a generic “no-reply” address.
A clear, specific subject line generally performs better than a vague or overly clever one. The preheader, the short text that appears after the subject line, is valuable space that is frequently left blank or defaulted to generic text.
One caution worth noting: it is possible to increase open rate artificially with a misleading or exaggerated subject line.
This approach tends to backfire; it may win the open, but it typically reduces CTOR, increases unsubscribes, and raises spam complaints, since the content fails to match expectations set by the subject line.
List quality, segmentation, and deliverability
This factor is often underestimated. A smaller, well-segmented, engaged list will consistently outperform a larger, disengaged one, even though the larger list may appear more valuable on paper.
Inactive contacts, unresolved hard bounces, and low sender reputation all reduce deliverability, meaning fewer emails reach the inbox in the first place, before open rate even becomes a factor.
In practice, list quality has a greater impact on open rate than list size.
How can marketers improve open rates without hurting trust?
The objective should not be to manipulate the metric, but to build a sending practice that earns opens sustainably: segmentation, list cleaning, testing, frequency preferences, behavior-based automation, re-engagement campaigns, and alignment between subject line and actual offer.
Audience quality and relevance should take priority over any single tactic aimed at lifting the number itself.
A practical optimization checklist
The following checklist covers the levers most likely to move open rate without compromising deliverability or subscriber trust:
- Authenticate the sending domain (SPF, DKIM, DMARC) to support inbox placement
- Remove subscribers who have been inactive for six months or more
- Segment by behavior (past purchases, click history, engagement level), not only demographics
- A/B test subject lines on a portion of the list before sending to the full audience
- Optimize send time based on when the specific audience engages
- Review sending cadence regularly, since more frequent sending does not always improve results
- Personalize where it is meaningful, beyond a first-name merge field
- Monitor complaint and unsubscribe rates as an early indicator, not only as a secondary metric
What benchmark should a business actually use?
Industry averages are a useful starting point, but they should not be the only reference point used to judge a campaign.
A more complete approach layers three levels of benchmark: the industry average, the account’s own historical performance, and the typical range for that specific campaign type.
Used together, these three levels give a far more accurate read than any single published number.
Internal benchmarks vs industry benchmarks
The best comparison point is the trend of the account’s own operation over time, not a public average.
Tracking open rate, CTR, and conversion rate on a rolling three-to-six-month window, broken out by campaign type, reveals patterns that a published industry average cannot: which subject line styles resonate with a specific audience, which send times perform best, and which segments are becoming more or less engaged.
A simple benchmark scorecard to adopt
The following framework is a practical way to track performance on an ongoing basis:
| Campaign type | Audience Segment | Delivered | Open rate | CTR | CTOR | Conversion | Unsubscribe rate |
|---|---|---|---|---|---|---|---|
| Welcome series | New subscribers | 4,800 | 42% | 5.0% | 12% | 3.5% | 0.2% |
| Promotional | Active buyers | 22,000 | 24% | 3.0% | 12.5% | 2.2% | 0.4% |
| Newsletter | Full list | 35,000 | 28% | 2.4% | 8.5% | 0.9% | 0.3% |
| Re-engagement | Dormant contacts | 7,500 | 14% | 1.0% | 7% | 0.5% | 0.8% |
Illustrative figures, coherent with the ranges above. Replace them with your own account’s historical numbers.
Updating this scorecard monthly, by campaign type, builds the most reliable benchmark a business can have: its own historical performance.
How can AI optimize campaigns for revenue instead of open rate?
Open rate is a top-of-funnel metric, and it is increasingly a limited one. A recipient can open an email, take no meaningful action, and move on.
What ultimately matters to the business is whether that email generated revenue that would not have occurred otherwise.
A similar shift has already taken place in paid media. Marketers once selected audiences, channels, and creative manually for every campaign. Today, algorithms handle much of that decision-making in real time, optimizing for outcomes rather than for impressions or clicks alone.
Lifecycle and CRM marketing is now undergoing the same transition. Rather than manually building and maintaining static journeys, teams are increasingly defining the objective and the guardrails, and allowing an algorithm to decide who to contact, through which channel, with which message, and when, optimizing for conversion and incremental revenue rather than opens.
This is the category RevBridge was built for: an outcome-based CRM with AI decisioning at its core and email marketing is part of that.
Why opens are a vanity metric — measure incremental lift instead
Opening an email is not the same as making a purchase, and given the tracking limitations discussed earlier, it is not always a reliable signal of interest either. The more meaningful measure is incremental lift: the additional revenue a campaign generates beyond what would have occurred without it, typically validated against a control group.
Incrementality changes the underlying question from “did people open this?” to “did this campaign generate revenue that would not have happened otherwise?”, a higher and more accurate standard for evaluating success.
From manual A/B tests to real-time optimization
Traditional A/B testing runs one experiment at a time: a variant is selected, the campaign waits for statistical significance, a winner is declared, and the process restarts for the next campaign. This approach is effective but slow, and it resets with every new send.
A modern decisioning engine, often built on a Multi-Armed Bandit combined with reinforcement learning, operates differently. Instead of running a single test sequentially, it runs many experiments in parallel across channel, message, frequency, and timing, learning continuously and shifting traffic toward what performs best in real time.
The incentive model follows the same logic: rather than paying for send volume, the business pays for conversions, aligning the platform’s success with the business’s own results.
Open rates show who looked. They don't show who bought.
RevBridge optimizes every send for incremental revenue, selecting the best channel, message, and timing for each customer in real time.
FAQ
What is the 80/20 rule in email marketing?
About 80% of email content should provide genuine value (education, useful updates) and only 20% should be directly promotional. This builds trust so promotional messages land better. B2B often leans more conservative (90/10); frequent-purchase ecommerce can go higher on promotion.
What is the 60/40 rule in email marketing?
In cold outreach, it’s a looser version of 80/20: roughly 60% value, 40% promotional, since early-funnel emails need more directness. It’s also used to say 60% of results come from list quality and segmentation, versus 40% from copy and design.
What is the 30/30/50 rule for cold emails?
A cold email structure: 30% personalization (proving specific research), 30% value proposition (a concrete benefit), and 50% building toward a clear, low-friction call to action. The common mistake is over-investing in personalization and under-investing in the ask.
 21 min read
Remarketing: What It Is, How It Works, and How to Run a Campaign
Learn what remarketing is, how it works, the main types, metrics, and best practices to create more effective campaigns.

 20 min read
What Is Martech? Meaning, Stack, and Tools in 2026
Learn what martech is, how it works in practice, and how AI, automation, and data help companies optimize marketing results.
 15 min read
Best Time to Send Marketing Emails in 2026: Ultimate Guide
What the data says about the best time to send marketing emails, how audience, industry, and campaign type change it,…

 16 min read
What is CRM (Customer Relationship Management)?
What CRM is, how it works, the four types, the benefits for sales, marketing, and support, and how to choose…